Use NART for long amplicon profiling by read classification
NART is desgined for mapping-based Nanopore Amplicon (Real-Time) analysis, e.g., 16S rRNA gene. NART utils are composed of nart (Nanopore Amplicon Real-Time entry) and nawf (Nanopore Amplicon snakemake WorkFlow entry) in one python package. NART provides an (real-time) end-to-end solution from bascecalled reads to the final count matrix through mapping-based strategy. You can
nawf provide three options (i.e., emu, minimap2lca and blast2lca) to determine microbial composition. 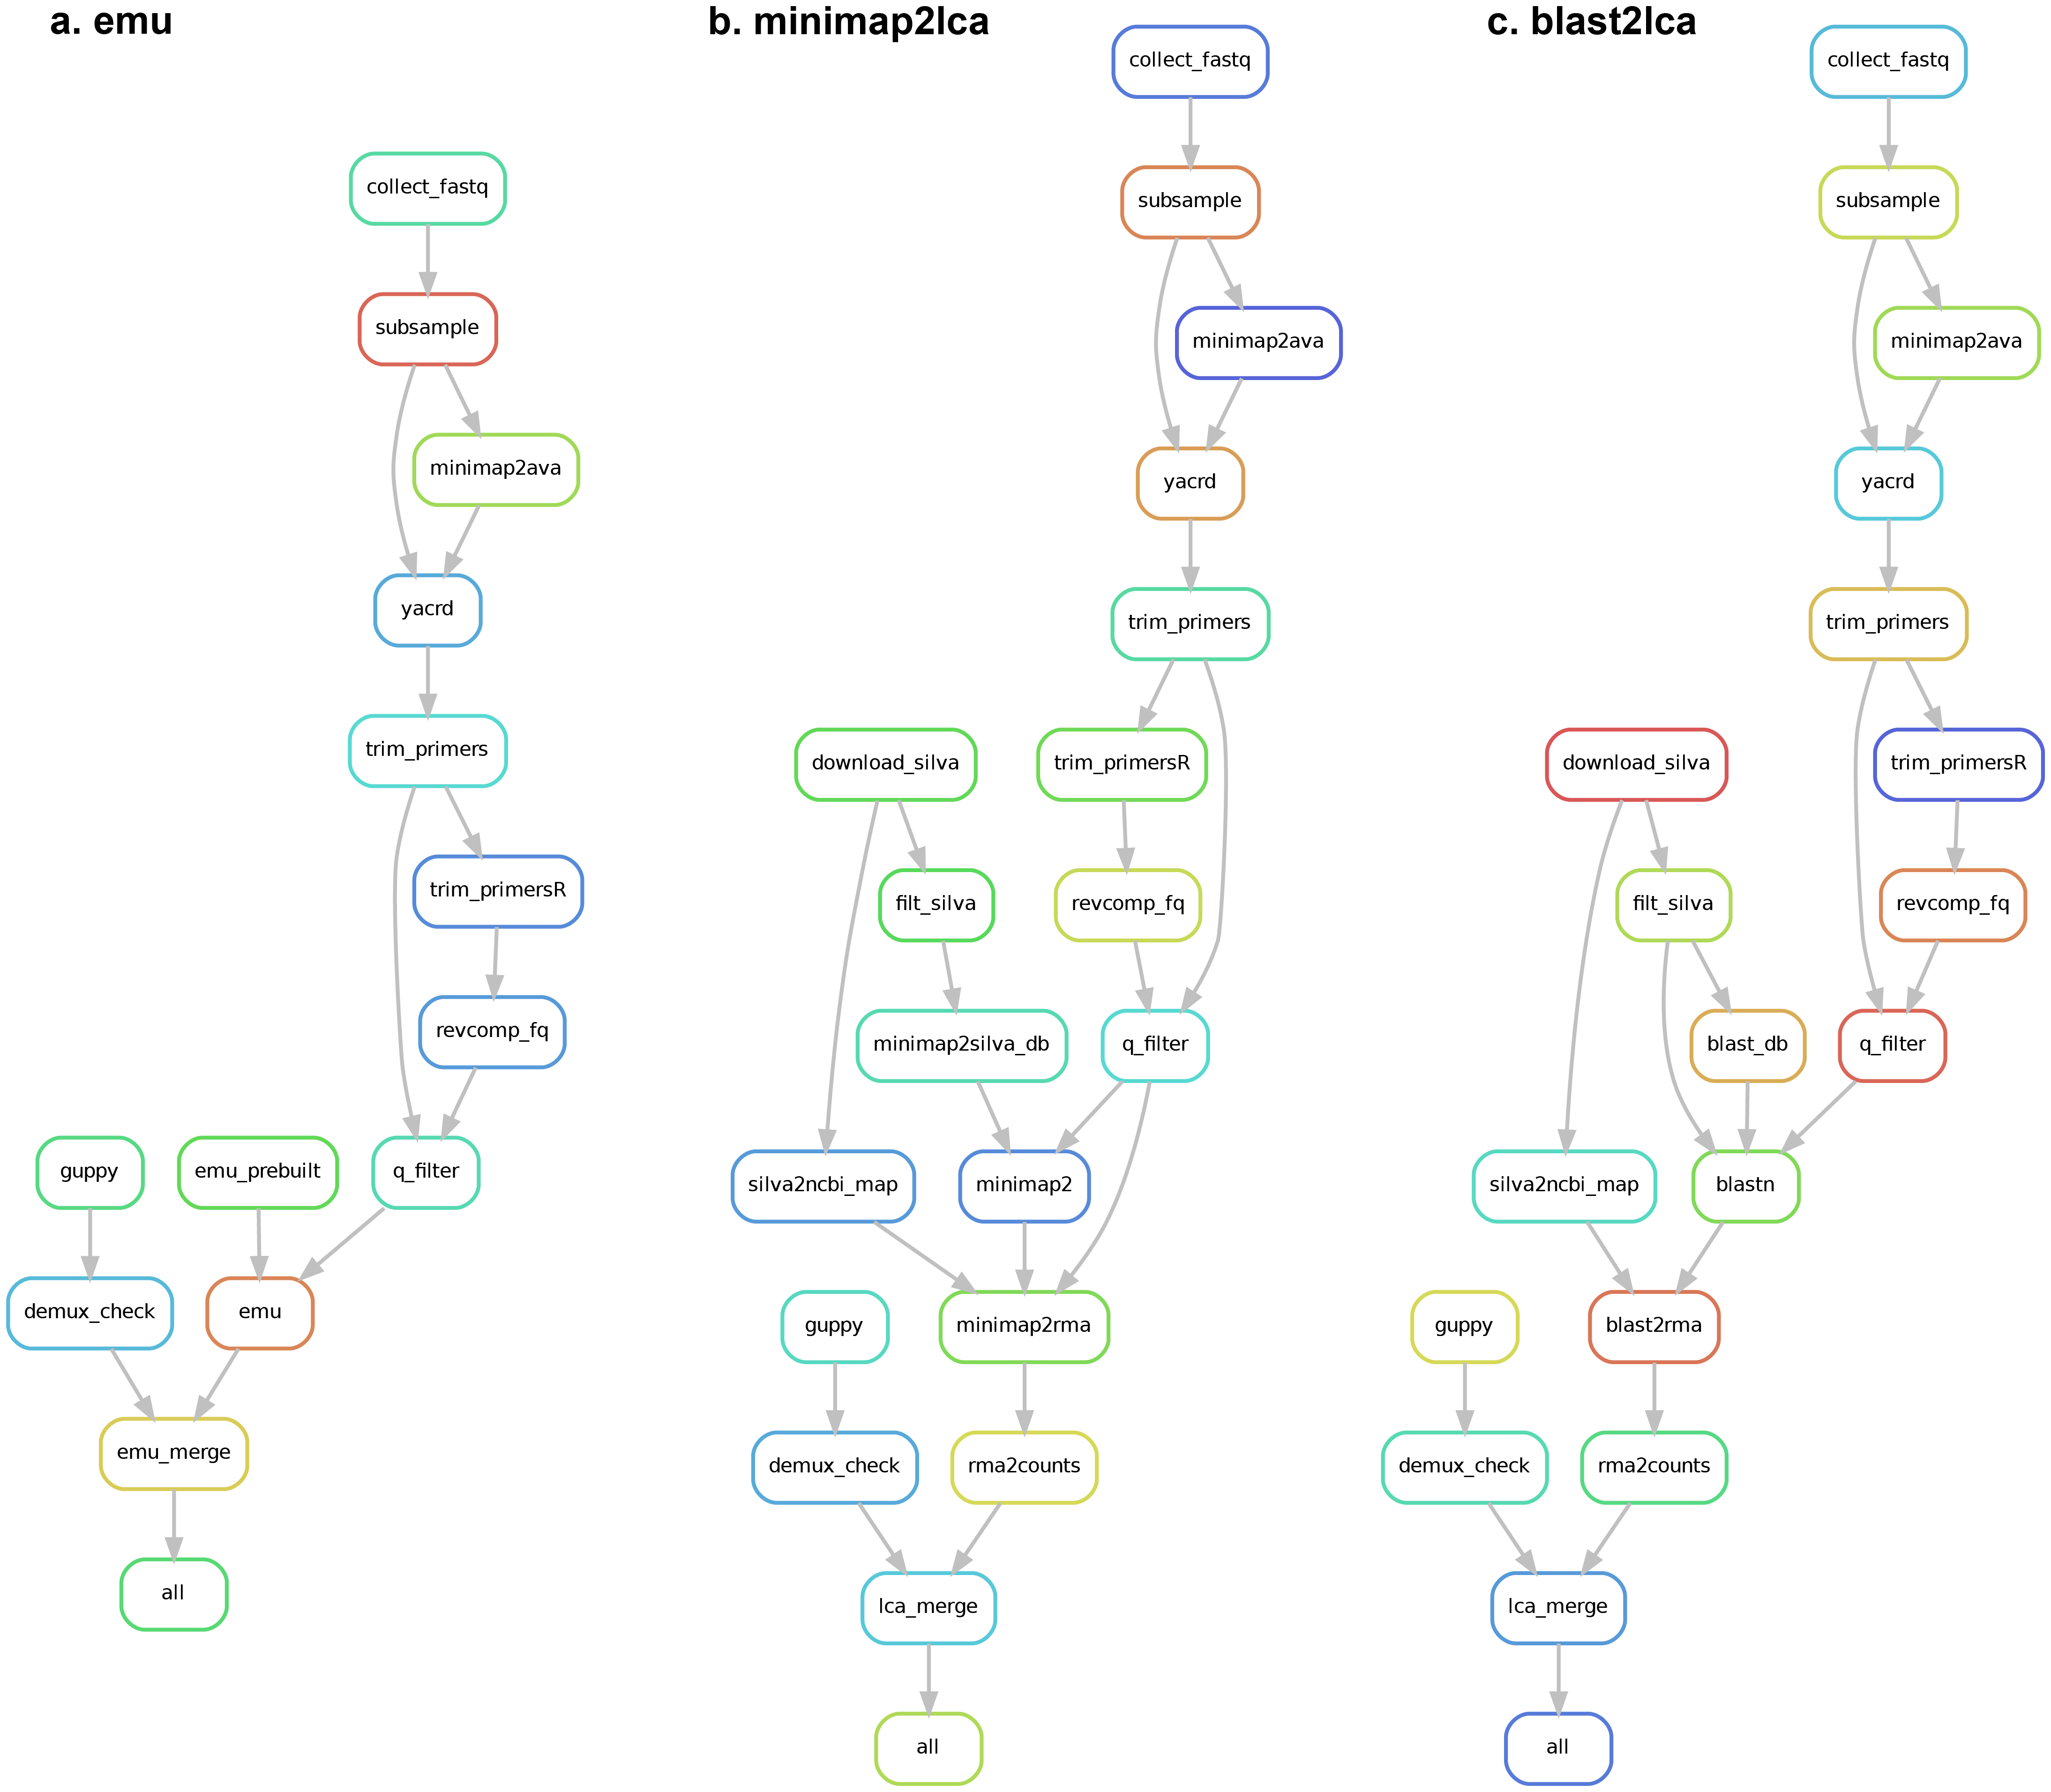
NART installation
The full installation guide of NART is available here.
You can choose to install NART with docker image (which is only solution for MacOS users) or from the GitHub repository according to your OS and preference.
Docker image
The easiest way to use NART is to pull the docker image from Docker Hub for cross-platform support.
docker pull yanhui09/nart
NARTis built forlinux/amd64platform, with cross-platform support throughdocker.
MacOSusers needs to use docker container to runNART.
Installation from GitHub repository
1. Clone the Github repository and create an isolated conda environment
git clone https://github.com/yanhui09/nart.git
cd nart
mamba env create -n nart -f env.yaml
2. Install NART with pip
To avoid inconsistency, we suggest installing NART in the above conda environment
conda activate nart
pip install --editable .
A demo run with NART
Find a full usage guide here.
A video tutorial can be found here.
Example with a quick start
Amplicon analysis in single batch
nawf can be used to profile any single basecalled fastq file from a Nanopore run or batch.
nawf config -b /path/to/basecall_fastq -d /path/to/database    # init config file and check
nawf run all                                                   # start analysis
Real-time analysis
nart provide utils to record, process and profile the continuously generated fastq batch.
Before starting real-time analysis, you need nawf to configure the workflow according to your needs.
nawf config -d /path/to/database # init config file and check
In common cases, you need three independent sessions to handle monitor, process and visulization, repectively.
1. Minitor the bascall output and record
nart monitor -q /path/to/basecall_fastq_dir # monitor basecall output
2. Start amplicon analysis for new fastq
nart run -t 10 # real-time process in batches
3. Update the feature table for interactively visualize in the browser
nart visual # interactive visualization
Get familiar with NART usage
NART is composed of two sets of scripts: nart and nawf, which controls real-time analysis and workflow performance, respectively.
Remember to activate the conda environment if NART is installed in a conda environment.
conda activate nart
nawf -h
nart -h
To use the docker image, you need to mount your data directory, e.g., pwd, to the /home in the container.
docker run -it -v `pwd`:/home --network host --privileged yanhui09/nart
nawf -h
nart -h
Note:
--network hostis required fornart monitorto work.
Run NART with a demo datset
0. Make sure you have downlowded the required demo dataset from here. And the enter the directory with cd.
E.g., Enter a directory with an absolute path (“long path”) is /home/me/MAC2023-extra.
cd /home/me/MAC2023-extra
If you haven’t downloaded the data yet and with Git installed,
git clone https://github.com/yanhui09/MAC2023-extra.git
cd ./MAC2023-extra
1. Analyze an accomplished ONT run with nawf
1.1. Check where you are and try laca init, check the genereated config.yaml file.
pwd
nawf config -b ./data/ont16s/*.fastq.gz -d ./database -w ./nart_output
cat ./nart_output/config.yaml
1.2. Start nawf in a dry run
nawf run all -w ./nart_output -n
2. Real-time analysis with nart
2.1. Re-generate the config.yaml file without -b flag
rm -rf ./nart_output
nawf config -d ./database -w ./nart_output
head ./nart_output/config.yaml
Check the changes of
basecall_fqin theconfig.yamlfile.
2.2. Monitor the bascalling output and record
nart monitor -q ./data/ont16s -w ./nart_output
nart monitor creates a fqs.txt in the working directory to record the coming fastq files.
2.3. Start amplicon analysis (requiring a new terminal)
nart run -t 4 -w ./nart_output
In a new terminal, check the actions of
nart monitorls ./nart_output cat ./nart_output/fqs.txt cp ./data/ont16s/*.fastq.gz ./data/ont16s/new.fastq.gz cat ./nart_output/fqs.txtCheck the changes of content in the
fqs.txtfile.
nart run stores the batch-specific count matrix under the folder batches. And the merged table (otu_table.tsv) is updated iteratively when a new matrix is created.
While you see one otu_table.tsv in the output folder, i.e., nart_output/, you can try the interactive visualization below.
2.4. Interactive visualization in a browser (requiring a new terminal)
nart visual -i ./nart_output
Open the generated link in your browser. And you are expected to see an interactive barplot as below. 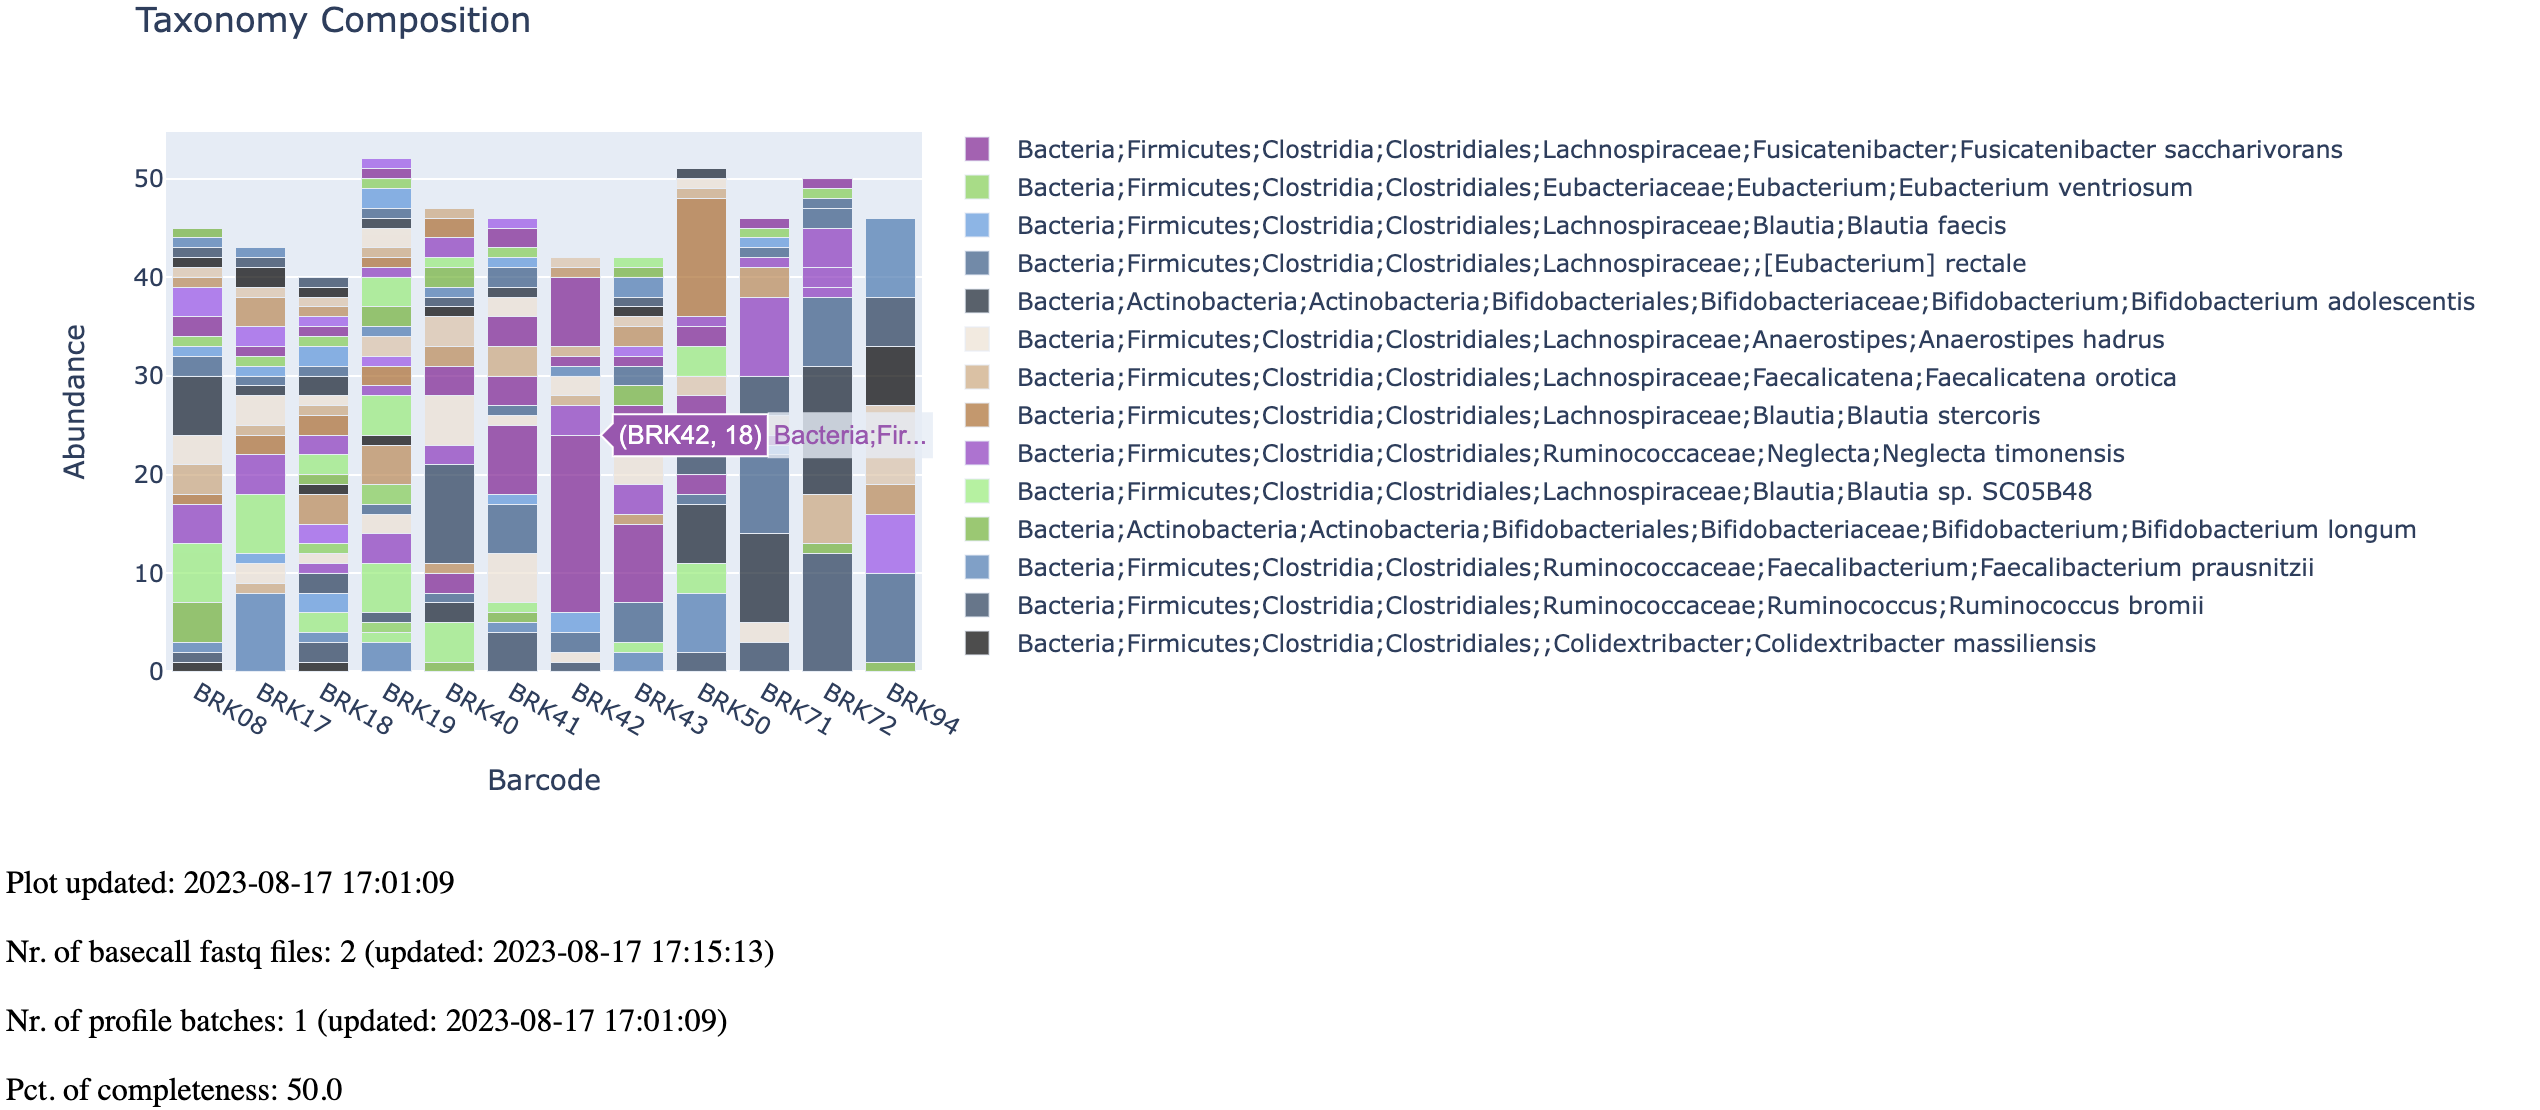
MacOSuser couldn’t experiencenart visualthroughdocker. :(The host networking driver only works on Linux hosts, and is not supported on Docker Desktop for Mac, Docker Desktop for Windows, or Docker EE for Windows Server. [Read more]